Daily Leverage Certificates
DLC Hotline: (65) 6226 2828
Market Commentary (Hong Kong)
For the week ending 29 March 2024
Spot Brent and WTI are now trading above their basket of moving average indicators and could be setting up for further gains.
● Official data from China showed that iPhone shipments in the country plunged 33% in February.
● Singapore-flagged container ship crashes into Baltimore bridge; port is closed to shipping. Baltimore is a major port and it is now reported that hazardous material may have spilled into the bay.
● USDJPY rose to a record new high in 34 years; a dollar buys 151.97 yen.
● Head of WIPO or World Intellectual Property Organization said that China is the world’s largest filer of intellectual property ranging from patents to trademarks.
● According to Korea’s National Statistical Agency, the country’s semiconductor production surged 65.3% compared to previous year. This is the largest increase since 2009. AI-related memory is the main driver.
Hang Seng Index closed this week at 16541, down 42 points or 0.25%. The index could be caught in a consolidation pattern based sideways movement over the past six weeks. 17000 overhead could be a potential resistance. In actual fact, effective resistance could be lower as the highest end-of-week close so far was 16726 made six weeks ago. 16000 below could be a potential support. Again effective support could be higher as the lowest end-of-week close was 16353.
There is a certain symmetry in the price action based on the rectangular channel. The swing low printed in January and February this year below the channel could be a ‘head’. The consolidations on either side resemble ‘shoulders’. The pattern as a whole could therefore be a potential bullish reversal pattern. HSI closed below all of its moving average indicators except the 50-Day SMA (purple). Therefore the whole setup is likely still associated with downtrend.
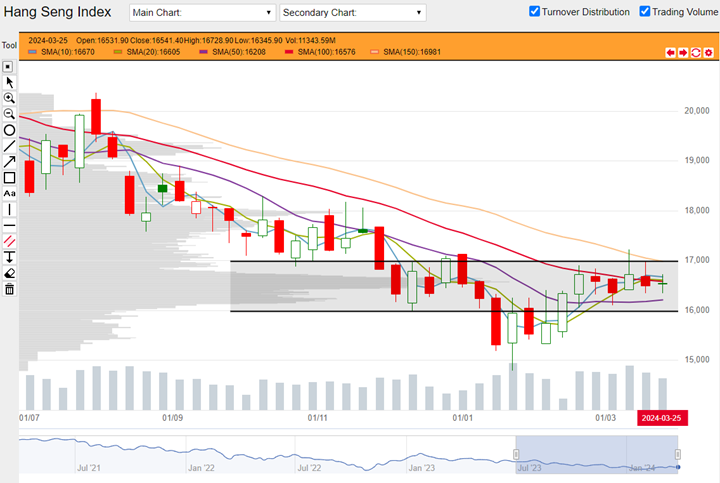
HSI weekly chart from 02 January 2023 to 29 March 2024 (Source: DLC.socgen.com)
Hang Seng Tech closed the week at 3478, down 84 points or 2.48%. Based on price action over the past three weeks, HSTech appears to be resisted by the 100-Day SMA (red) overhead. This week it closed down below its 10- and 20-Day SMAs which indicate its short term trend. In combination, it is possible that this is a setup associated with further losses.

HSTech weekly chart from 02 January 2023 to 29 March 2024 (Source: DLC.socgen.com)
Both Dow and Nasdaq closed above their entire complex of moving average indicators. Such a setup is associated with further gains.
The next FOMC meeting is scheduled on 01 May 2024.
Fed funds futures on rate hike probability by next Fed meeting as at this week’s close:
● 95.8% probability of no change |4.2% probability of 25 basis points cut
Fed funds futures on rate hike probability by next Fed meeting at last week’s close:
● 87.7% probability of no change |12.3% probability of 25 basis points cut
Probabilities on the CME Fedwatch Tool indicate no more rate hikes for this year but also indicate possibility for rates to stay at current level until April next year. Probabilities predict a cumulative 150 basis points cut for the whole of 2024 and up to 200 basis points between now till April 2025.
Shanghai closed this week at 3041, down 7 points or 0.23%. Shenzhen closed at 9401, down 165 points or 1.72%. Shanghai is now trading above its 50-, 100- and 150-Day SMAs. This could provide some basis for potential reversal by providing potential support below.
Other news:
● AIA, Kuaishou, Sinopec, Sunny Optical, Tencent and Xiaomi bought back shares.
● AAC Technologies and Petrochina printed new 52-week highs. Sunny Optica printed a new 52-week low.
● Netease is suing a Tencent unit for alleged plagiarism from a mobile game.
● Xpeng plans to sell its electric SUV in Singapore, Malaysia and Thailand; deliveries are expected to start in Q3 this year.
Technical observations
Tencent 700.hk broke trendline, sports a potential double bottom.
Note chart features:
1. There is a downward trendline going back to early 2023. This trendline connects the highest end-of-week close on the weekly chart. Tencent broke this trendline last week. If we connect extreme highs instead (not illustrated here), then Tencent broke it this week. This break could signal a change of trend. Changing a downtrend could lead to a reversal and subsequent uptrend but it could also lead to a sideway range.
2. Based on swing highs and lows going back to October last year, there is a potential support-resistance zone between $286 - 293. Tencent broke above this zone this week. It might take a couple of weeks to show whether this is a genuine break or not but this is promising because this break basically set a new fourteen-week high and also left behind a W-shaped pattern below this zone. This could be a reversal pattern. The W-shape is most easily spotted when we switch to a line chart.
3. For now some chart elements disagree with the bullish observations above. Moving averages are still arranged in a setup most associated with downtrend. Additionally this week’s break was not accompanied by high volume although do note that this is a short trading week followed by a long weekend.
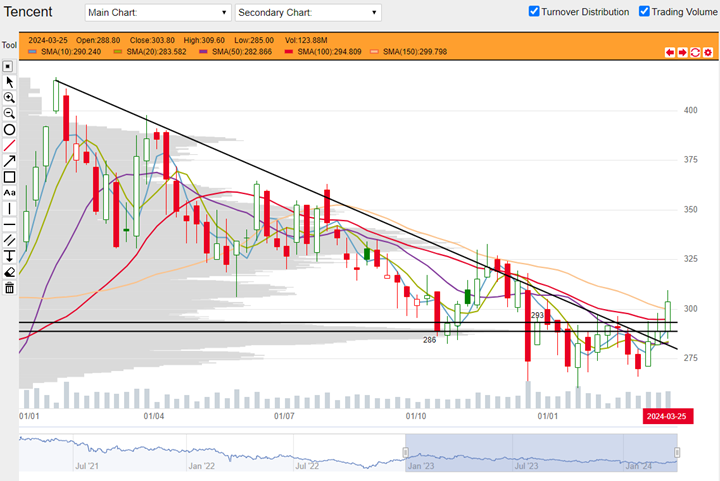
Tencent 700.hk weekly chart from 02 January 2023 to 29 March 2024. (Source: DLC.socgen.com)
Underlying Index/Stock |
Underlying Chg (%)1 |
Long DLC (Bid Change%2) |
Short DLC (Bid Change%2) |
|---|---|---|---|
| Hang Seng Index (HSI) | -0.74% | ECSW (-2.56%) | CWXW (+6.23%) |
| Hang Seng TECH Index (HSTECH) | -1.18% | CWUW (-5.00%) | CVYW (+13.39%) |
| Tencent (0700.HK) | -1.26% | ZS6W (-5.92%) | EGCW (+8.07%) |
Brought to you by SG DLC Team
This advertisement has not been reviewed by the Monetary Authority of Singapore. This advertisement is distributed by Société Générale, Singapore Branch. This advertisement does not form part of any offer or invitation to buy or sell any daily leverage certificates (the “DLCs”), and nothing herein should be considered as financial advice or recommendation. The price may rise and fall in value rapidly and holders may lose all of their investment. Any past performance is not indicative of future performance. Investments in DLCs carry significant risks, please see dlc.socgen.com for further information and relevant risks. The DLCs are for specified investment products (SIP) qualified investors only.
Full Disclaimer - here